“Biometrics are our most unique physical (and behavioral) features that can be practically sensed by devices and interpreted by computers so that they may be used as proxies of our physical selves in the digital realm. In this way we can bond digital data to our identity with permanency, consistency, and unambiguity, and retrieve that data using computers in a rapid and automated fashion.”
Biometric System Accuracy Testing
The accuracy of a biometric system is quantified most typically by a “receiver operating characteristic”, or “ROC curve” plot indicating its “false match rate (FMR)” and “false non-match rate (FNMR)” against some biometric sample gallery. The false match rate is the frequency with which biometric samples from different sources are erroneously assessed to be from the same source. The false non-match rate is the frequency with which samples from the same source are erroneously assessed to be from different sources. A well-performing biometric system is characterized by prompt results and low rates of false matches and false non-matches. The accuracy of a system falls on a point on the ROC curve whose location is a function of the matching “threshold” applied. A higher match threshold reduces false match rate but increases false non-match rate (higher security, lower convenience). A lower match threshold reduces the false non-match rate but increases false match rate (higher convenience, lower security; See Figure 3). Higher quantities of data (e.g. more fingerprints) and higher-quality (highly consistent) samples are required for one-to-many search processes as compared to one-to-one matching for verification.
It is important to recognize that biometric system accuracy is highly dependent on the nature of the biometric data in the system. Every different biometric data gallery against which a set of probe samples is searched will yield a different accuracy ROC curve. There are biometric galleries in the public domain, and they serve to provide common benchmarks to compare different matching algorithms. But algorithms can be “trained” to work better on known databases, which is analogous to seeing the questions on a test before taking it. Doing so will improve their comparative accuracy on known databases, but does not necessarily indicate the performance of the system on unknown data, as is the case in a real-world scenario. So the best way to predict how a biometric system will behave in a real-world deployment is to test its performance on data to which it has not been explicitly trained.
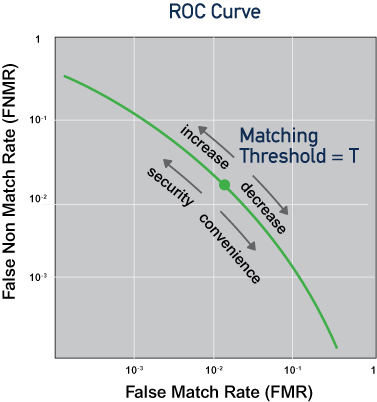 Figure 2 – An ROC curve for a given biometric matching system and dataset
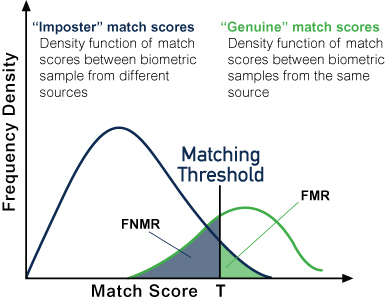 Figure 3 – Density functions of comparison scores between a) samples from different sources and b) samples from the same sources, illustrating FMR and FNMR.


